EIAV -- Equine Infectious Anemia Virus, an example of DNA data
The R script
(ex_eiav.r)
demonstrates functions to read two files,
pony524.phy
in PHYLIP format and
pony625.fas
in FASTA format, and
visualize mutations. It simply runs the phyclust()
by two clusters with a default setting
- Both data sets are available in
phyclustand NCBI database, and original from Baccam, P., et al. (2003).
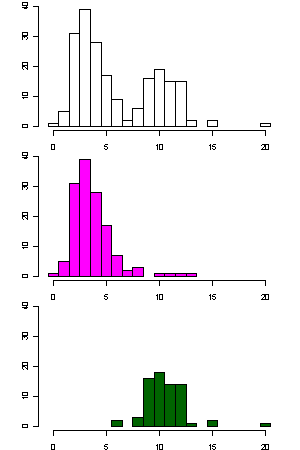
- The left picture shows the histograms of the number of mutations with respect
to the center of the first cluster.
- The x-axis is the number of mutations, and the y-axis is the counts.
- The top plot uses all 208 sequences; the middle plot uses the 137 sequences in the first cluster; and the bottom plot uses the 71 sequences in the second cluster.
- At least two clusters can be expected.
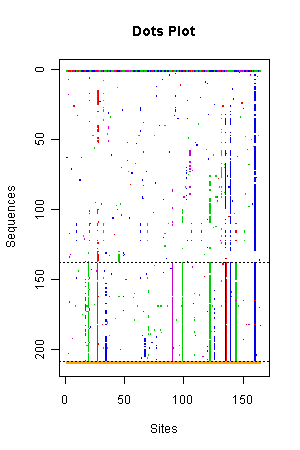
- The right picture shows the mutations of 165 segregating sites,
out of 405 sites, in two clusters.
- Colored dots represent mutation types and sites with respect to the first sequence of the first cluster, the only one sequence drawn entirely.
- The first cluster may be able to split into several clusters.
- The second cluster tends to be having more mutations than the first cluster in the segregating sites from 1 to 50 and 110 to 150.
 |
 |